Website Heat Maps: Increase Conversion and Improve UX For Affiliate Landing Pages With Heatmap Software
Today, folks, I want to talk about something pretty important: website heatmaps and their tools. To be honest, it's a complex topic that can't be fully covered in one short article.
Here’s why
- Heatmaps provide just one of many metrics you might need.
- The data from heatmaps only comes from users who share their cookies with you.
- Different website heatmap tools offer different reports, and they might not all be comparable.
- Interpreting heatmap tool reports correctly can be tricky, and changes based on them might still be more intuitive than fact-based.
After reading this, you might think heatmaps aren’t worth it. But you’d be mistaken! They’re still one of the best tools for long-term marketing. Until we can read customers’ minds, heatmaps are our best bet. So, today I’ll break down the basics of heatmaps with a touch of humor and simplicity. Here’s what will be covered:
- What are heatmap tools for websites overall?
- What’s the deal with scroll maps? And what types of heatmapping can help with conversions?
- What software is available for experimenting with heatmaps right now?
- Why heatmaps are awesome?
- Why heatmaps might be not THAT awesome?
- The real top tools for improving conversions and why they might not work in CPA marketing.
And a lot more about heatmaps, conversions, tricks, hints, and making money. So get ready, because we're about to turn up the heat!
- So What Are Heatmaps, Anyway?
- Types Of Website Heatmaps And Their Usability
- Click Data Heat Map
- Scroll Maps
- Attention/Move Website Heatmaps
- Top Software To Use Heatmaps To Improve Your Website
- How to Add Heat Map to Website
- Why Heatmaps Aren’t Always Great for Boosting Conversions
- End-to-End Analytics vs. Website Heatmaps
- Use A/B Tests To Improve Your Website Experience
- Conclusion: Should you use a heat map for a website?
So What Are Heatmaps, Anyway?
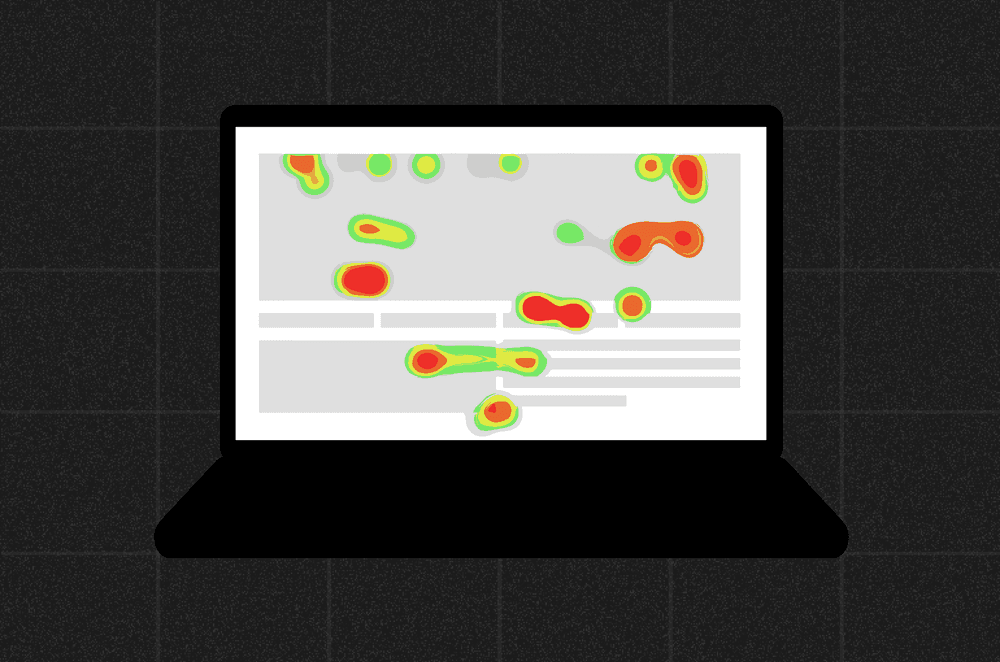
To put it simply, a heatmap is a data visualization tool. See, heatmaps help demonstrate how visitors interact with your site by tracking their clicks, movements, and scrolls. They work best if your site has a steady flow of visitors. By analyzing the data, you can see where people are clicking and where they’re ignoring.
As you can see, understanding how people interact with your site, landing page, or portal can help you:
- Cut down on wasted space with a website visitor heatmap.
- Adjust offers or reposition elements based on data from web page heat maps.
- Analyze how everything is performing.
There are many different types of heat maps and tools available. But here’s a point to consider: heatmaps are most effective when you have a lot of traffic, like hundreds of users a day. Note that heat maps for forced versus organic traffic can vary. Now that we’ve covered this, let’s move on to the details.
Types Of Website Heatmaps And Their Usability
Any reliable website heatmap tool like the ones below helps optimize and improve website performance. They serve as data visualization tools that help understand how people interact with your website pages.
Name of Map | What It Analyzes | Best For |
|---|---|---|
Click Map | User clicks on different pages | Website optimization, conversion rate optimization |
Scroll Map | How far users scroll down a page | Content-heavy websites, blog pages |
Move Map | Mouse movement and tracking | User behavior analysis, improving website design |
Attention Map | Areas where users spend most time | Landing pages, e-commerce sites |
Confetti Map | Individual clicks with segmented data | Detailed behavior analytics, CRO tool |
Geo Heatmap | Geographic location of visitors | Localized content optimization, marketing strategies |
Form Analytics Map | Interaction with form elements | Improving form conversion rates |
Click Data Heat Map
A Click Data Heatmap shows where users click on your web page. It highlights every popular and less popular element on your website with different colors, making it easy to see where people are clicking the most. This helps you figure out which buttons, links, or images attract the most attention.
Scroll Maps
Scroll Maps track how far down users scroll on your web page. They act like footprints, showing how much of your page people are actually seeing. With this heatmap data, website owners can find out if users are missing useful info at the bottom. Tools like Google Analytics help you see where people get bored and stop scrolling. Scroll Maps allow you to optimize your page for a better user experience (UX) so that important content isn’t overlooked.
Attention/Move Website Heatmaps
Attention/Move Website Heatmaps track where visitors move their mouse and pay attention to your web page. This heatmapping tool helps you see which parts of the page get the most attention. By visualizing this data, you can easily understand which elements of your website are most interesting.
Top Software To Use Heatmaps To Improve Your Website
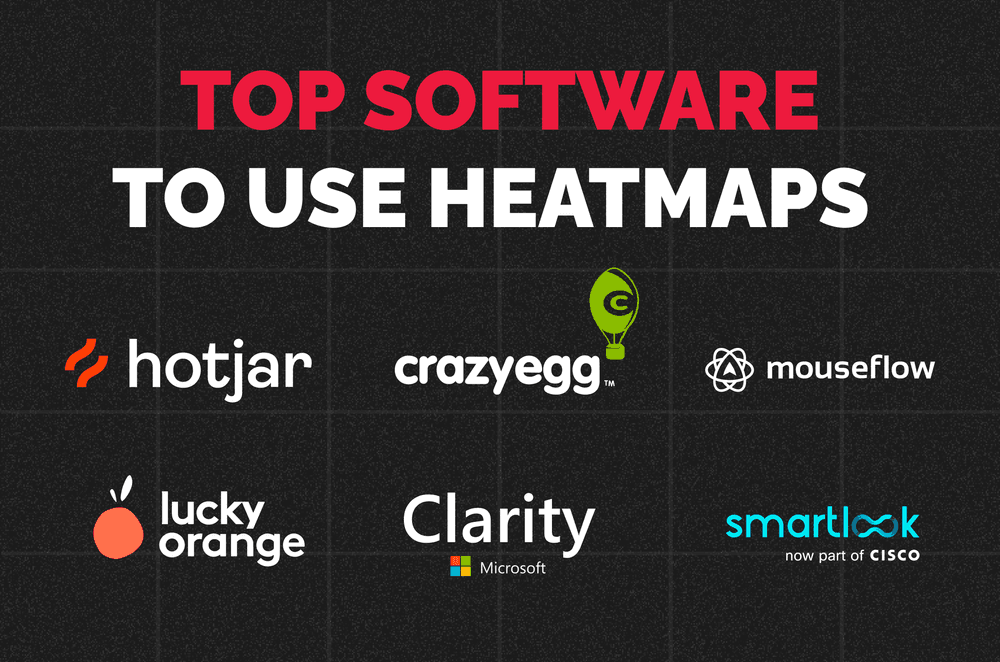
Using heatmap software can help you identify how visitors behave on your website, which parts they click on, and where they spend the most time. This helps improve performance and user experience on the website.
Software | Type of Heat Map | Monetization | Key Features |
|---|---|---|---|
Hotjar | Click, Scroll, Move, Attention | Free and Paid | Easy to set up, behavior analytics tool, heatmap report, web analytics |
Crazy Egg | Click, Scroll, Confetti | Paid | A/B testing, website redesign, detailed user data |
Mouseflow | Click, Move, Attention, Form | Paid | Mouse tracking heatmap, real-time data, behavior analysis |
Lucky Orange | Click, Move, Geo, Form | Paid | Live chat, dynamic heatmaps, website tool |
Microsoft Clarity | Click, Scroll, Move | Free | Free heatmap software, session recordings, user data visualization |
Smartlook | Click, Move, Attention | Free and Paid | Customizable reports, web analytics, behavior analytics tool |
How to Add Heat Map to Website
- Choose a Heatmap Tool — Select a tool like Hotjar, Crazy Egg, or Microsoft Clarity.
- Sign Up — Visit the tool’s website and create an account.
- Get the Code — After signing up, the tool will provide you with a small piece of code.
- Copy the Code — Copy this code to your clipboard.
- Open Your Website Editor — Access the part of your website where you can edit the code (e.g., WordPress, Wix, or HTML files).
- Paste the Code — Locate the section where you can add new scripts and paste the code there.
- Save and Publish — Save your changes and publish your website.
- Check the Tool — Return to the heatmap tool’s website to confirm it’s tracking your site.
- View Heatmaps — Wait for visitors, then check the heatmap reports to see how people interact with your website.
Why Heatmaps Aren’t Always Great for Boosting Conversions
It might seem complicated, but here’s a simple truth before you try to set up a heatmap:
- Cookies — Heatmaps only work if users agree to share their cookies. Many people just click "yes" on pop-ups like "click to continue reading," which can frustrate them and drive them away from your site.
- Low Traffic — Heatmaps are most effective with lots of data, not with forced traffic. For example, if you have two banners with different offers leading to the same page, users from each banner might behave differently, making the data unclear. You need a lot of views to get accurate insights. Heatmaps are better suited for established sites with steady, organic traffic, not for new sites looking for quick results.
- Using Data — Heatmaps show how people interact with your site’s current design. Changing your design doesn’t guarantee users will interact the way you expect. Using heatmap data to improve your site requires careful analysis and often involves A/B testing.
So, until we find a better tool, heatmaps remain useful for visually tracking real-time user interaction on your site.
End-to-End Analytics vs. Website Heatmaps
What option for a website could be better than heatmaps, you may ask?
Well, end-to-end analytics offers a complete view of everything visitors do on your website or app, from start to finish. It tracks all user actions on various pages on your website! This helps you understand the entire journey, not just individual interactions. However, heatmaps can also be useful for showing specific data and are easier to set up. They help pinpoint the exact elements on a website where users interact the most.
End-to-End Process | Heat Map Cons |
|---|---|
Tracks full user journey | Only shows clicks or scrolls |
Provides detailed behavior analysis | Limited to specific actions |
Offers comprehensive data visualization | Can miss the full context |
Helps with complete website optimization | Focuses on parts of a page |
Better for understanding user flow | Needs additional tools for full analysis |
Useful for both website and app | Mainly used for websites |
Even though end-to-end analytics provide a broader view, plenty of people use the heatmap options because they are simpler to create and help visualize specific user interactions on different pages.
Use A/B Tests To Improve Your Website Experience
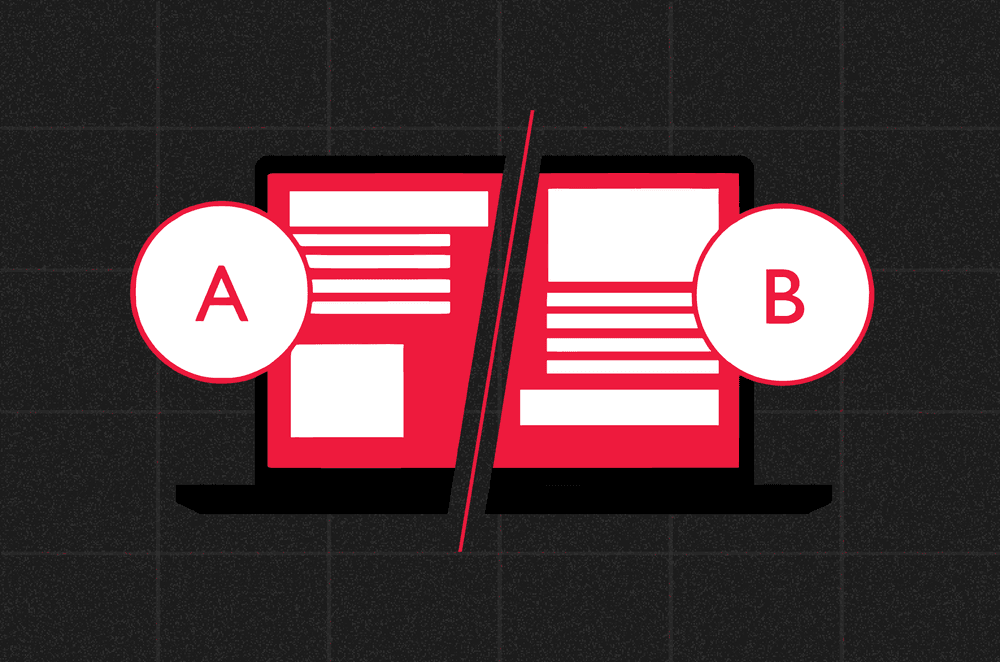
A/B testing helps greatly in improving the performance of a website. Whether you're looking at data or testing a hypothesis, it's crucial to back up your ideas and test them. Sometimes, your intuition offers better insights than marketing data, leading to a more successful funnel. Other times, changes might not yield the desired results.
When using software like heatmaps to graphically display real-time user interactions, you can gain plenty of valuable insights. Additionally, when users turn to website you own, you can identify areas for improvement.
Conclusion: Should you use a heat map for a website?
Heatmaps came from the mind of a software designer Cormac Kinney who created a tool to graphically display real-time info. Currently, website heatmap data still offers valuable insights into user interactions on an individual website. Now that you understand how to make any heatmap work and create one, let’s summarize their benefits and limitations.
Using heatmaps can help you understand how users interact with their website of choice. Heatmaps work by showing you where visitors click, scroll, and move their mouse. This helps you see which parts of your website get the most attention and which parts are ignored.
Website Heatmap can help you improve the performance of your website by highlighting areas that need optimization. When you use a website heatmap for getting data, you can make changes to your website elements to enhance user experience and increase conversions. However, heatmaps work best when you have a lot of traffic and when visitors agree to share their cookies. Without enough data, it’s hard to get accurate insights.
Heatmap uses vary based on your needs. Click maps show where people click, scroll maps show how far they scroll, and move maps show where they move their mouse. Each type of heatmap can help you understand different aspects of user behavior.
While heatmap analysis is a valuable tool, it is not perfect. Website heatmaps help you show only a part of the picture. So it’s important to use other tools, like end-to-end analytics, to get a complete view of user behavior.
In the end, it’s better to create a website heatmap as part of a larger strategy. They are easy to create and provide valuable insights into specific user interactions. By combining heatmap data with other analytics tools and A/B testing, you can customize your website for better performance and a better user experience.
So, should you use a heatmap for your website? Yes, if you want to improve how visitors interact with your website and increase conversions. Just remember to use the right tool, gather enough data, and always test your changes. This way, you can make informed decisions and create a website that works better for everyone.

Recommended Articles

Boost Your Affiliate Earnings: Mastering CRO in Dating
Affiliate Marketing for Dating Apps vs. Websites: What’s The Difference?